 The Golden Treasures of Google! Part 2
Google offer us so many fabulous projects and tools! Are You Ready for More?
Welcome to Part 2 in this series: The Golden Treasures of Google! The Fabulous Tools You Don't Know About!
Part 2 will focus on some fabulous data tools! Check out what data-driven Googliness lies below!
--->Did you miss Part 1 in this series: Google Maps, Street View and Earth?
Welcome to Part 2 in this series: The Golden Treasures of Google! The Fabulous Tools You Don't Know About!
Part 2 will focus on some fabulous data tools! Check out what data-driven Googliness lies below!
--->Did you miss Part 1 in this series: Google Maps, Street View and Earth?
Google Trends
Explore Google trending search topics with Google Trends. See what's trending, what's popular, and much more data!
Also, check out these special treasures:
In the Classroom: Google Trends is a great discussion starter. Ask students to analyze the data, make predictions, and talk about how the world is changing.
Also, check out these special treasures:
In the Classroom: Google Trends is a great discussion starter. Ask students to analyze the data, make predictions, and talk about how the world is changing.
Google Correlate
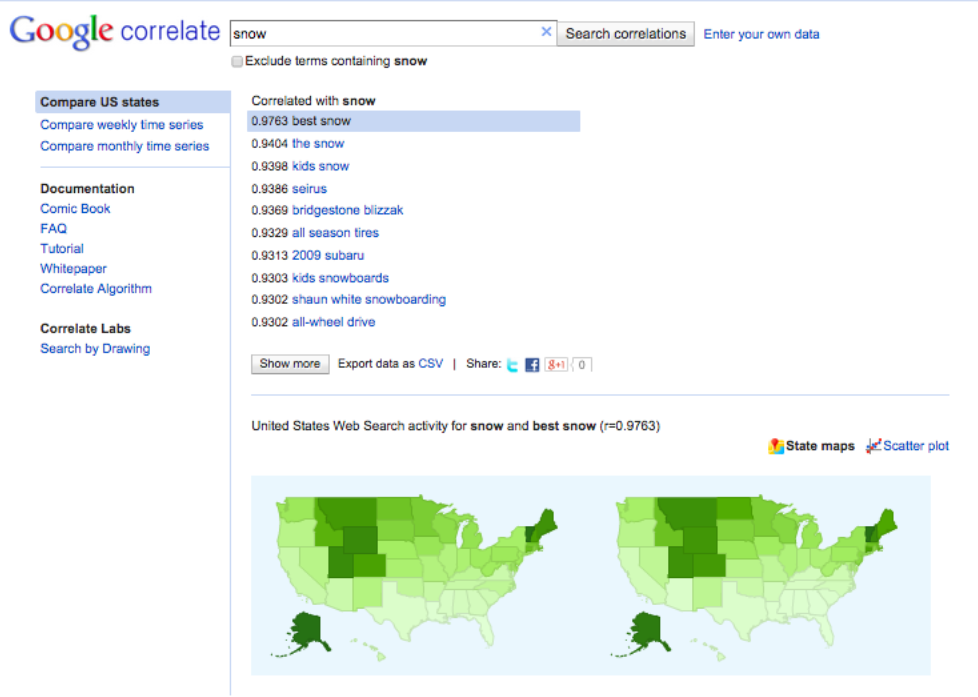
Google Correlate
Google Correlate is actually a part of Google Trends. It finds search patterns which correspond with real-world trends.
Check out this great Comic Book explanation of Google Correlate!
In the Classroom: Google Correlate is a great tool for finding correlations with current events like the Ebola outbreak. It is also a great way to explain the difference between correlation and causation to students!
Check out this great Comic Book explanation of Google Correlate!
In the Classroom: Google Correlate is a great tool for finding correlations with current events like the Ebola outbreak. It is also a great way to explain the difference between correlation and causation to students!
 |
 |
 |
Ngram Viewer
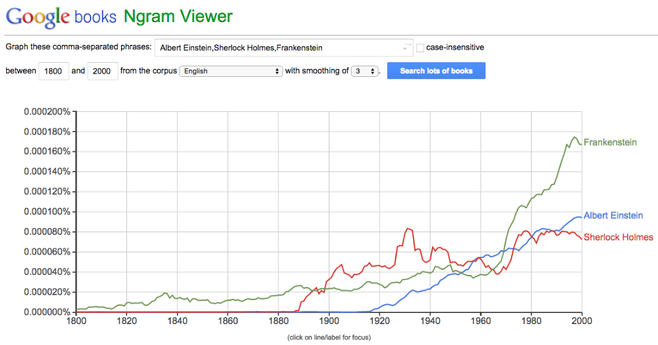
Ngram Viewer
Ngram Viewer is a part of Google Books. Five MILLION books have been archived covering a span of the last 500 years, and Google has made the data from those books searchable. Visualise the rise and fall of particular keywords across 5 million books and 500 years!
In the Classroom: This tool would be great for having students research keywords around a historical event like World War II and do a comparison with published works and popular authors of the time in Ngram Viewer.
In the Classroom: This tool would be great for having students research keywords around a historical event like World War II and do a comparison with published works and popular authors of the time in Ngram Viewer.
Google Public Data Explorer
The Google Public Data Explorer makes large datasets that are made publically available by the government and other agencies easy to explore, visualize and communicate. Here you can find everything from unemployment and population to Ebola and weather.
Four types of visualizations :
In the classroom: There are so many ways that this data and the visualizations could be used in the classroom. These statistics would be great for research projects, geography, authentic math problems, and more!
Four types of visualizations :
- line chart
- bar chart
- map
- scatter plot
In the classroom: There are so many ways that this data and the visualizations could be used in the classroom. These statistics would be great for research projects, geography, authentic math problems, and more!
Did you miss Part 1 in this series: Google Maps, Street View and Earth?
What are your favorite Google tools? Please share in the comments below.
Kasey Bell will be presenting at the following upcoming events:
What are your favorite Google tools? Please share in the comments below.
Kasey Bell will be presenting at the following upcoming events:
- #GAFETalk Event with TextHelp, April 8-9 (Denver and Colorado Springs)
- #GoogleEduOnAir (May 8-9)
- #TXGoo15, May 16: Texas Summit feature Google for Education (New Caney, TX)
- iPadpalooza, June 23-25 (Austin, TX)